The responsive design used can cope with all display sizes and resolutions. Thus, a change of display is possible without any adjustments of the current dashboard.
Our customers particularly appreciate MOCHA’s flexibility: being able to connect RESTful APIs and create custom SQL-based checks provides the possibility of linking practically any external data source. For example, performance data of one or several database servers can be displayed along with the number of open tickets or changes provided by a service management tool. You yourself decide which, if any, thresholds need to be defined.
Connection of a wide variety of applications via the RESTful API and consolidated display of required information in MOCHA.
Dynamic adaption of already created dashboards to different devices – completely without any additional effort or redesign.
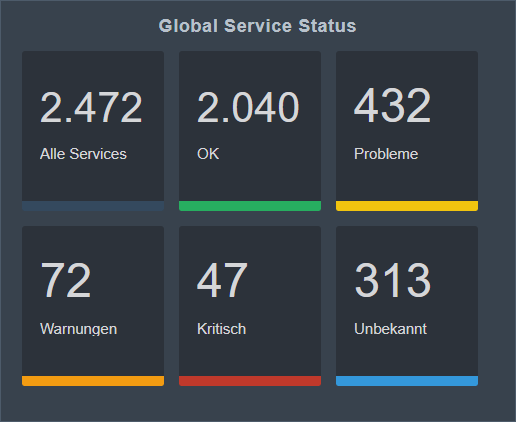
Forget about the times of overloaded, unattractive dashboards! MOCHA offers you state-of-the-art designs and display options.
Standardised definitions allow you to either create the necessary dashboards yourself or to leave the preparation to our specialists. We will be happy to advise you regarding possible designs and structure of your dashboards. As the Monitoring Module, MOCHA adapts to your requirements – not the other way round. We are aware of the diversity of IT infrastructures and we also know that a flexible monitoring with ideal display options is imperative.
Modular Structure
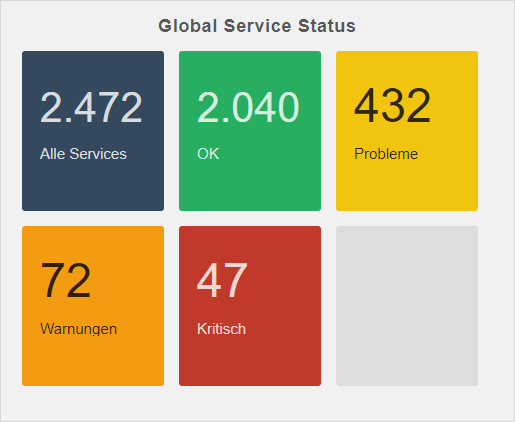
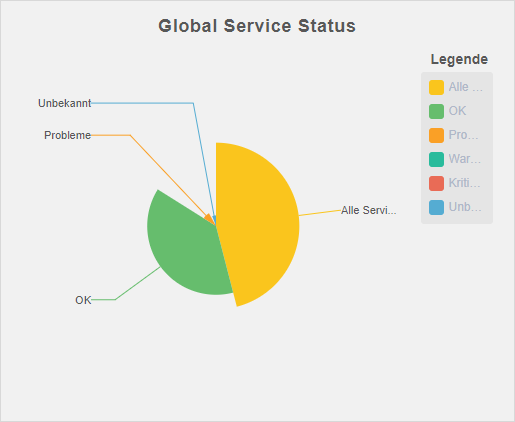
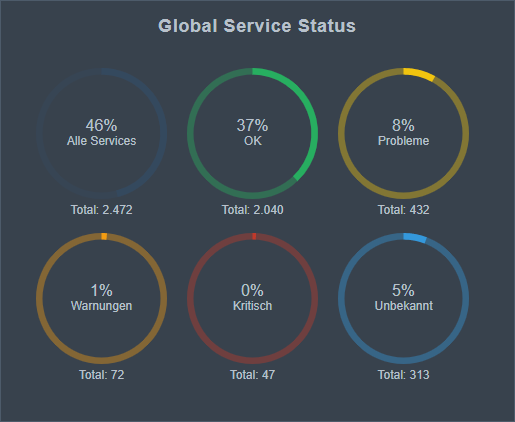
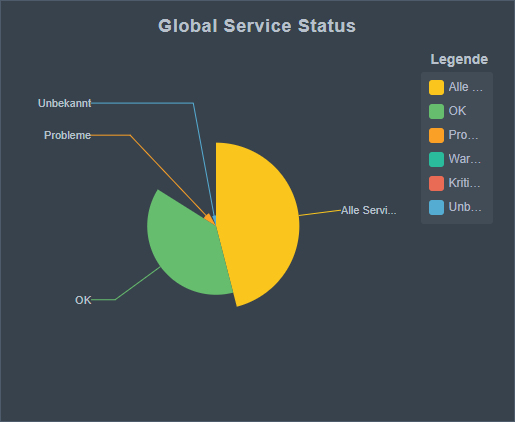
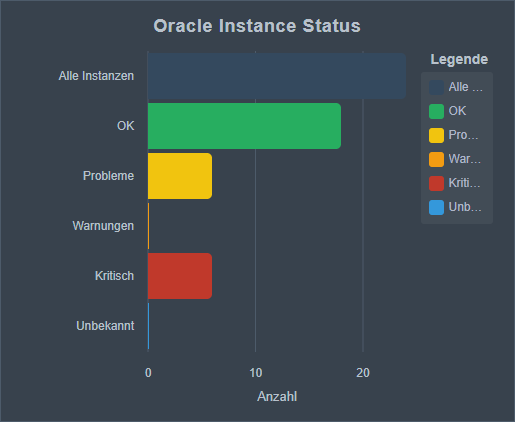
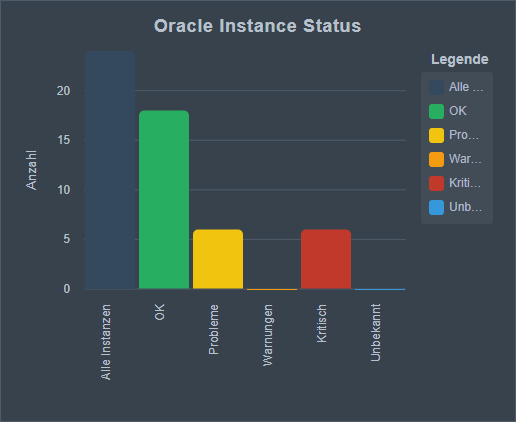
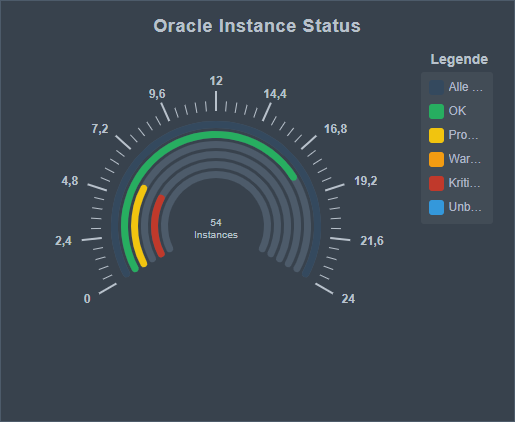
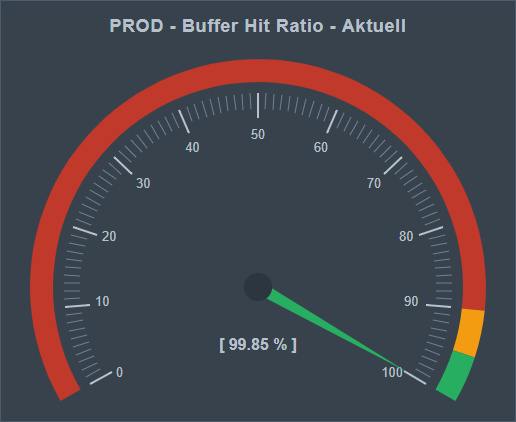
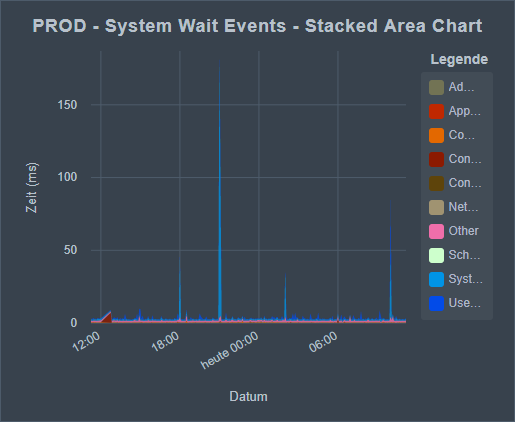
Use the many existing dashboard components…
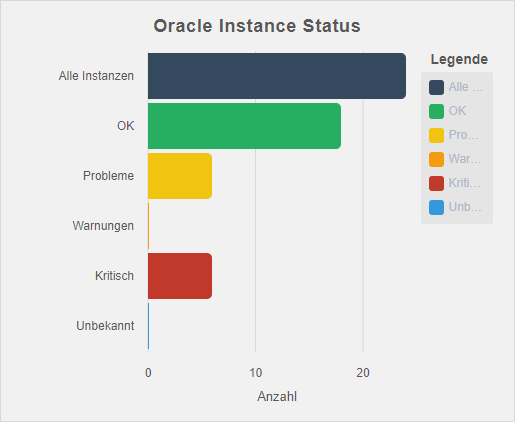
… and create your own personal dashboard.